- In SAP you can plan demand in three places: S/4HANA (planned independent requirements and pMRP), IBP for Demand (statistics, machine learning and demand sensing) or the legacy APO DP.
- The tool matters less than the process: a forecast is only useful if someone reviews, adjusts and agrees it every month.
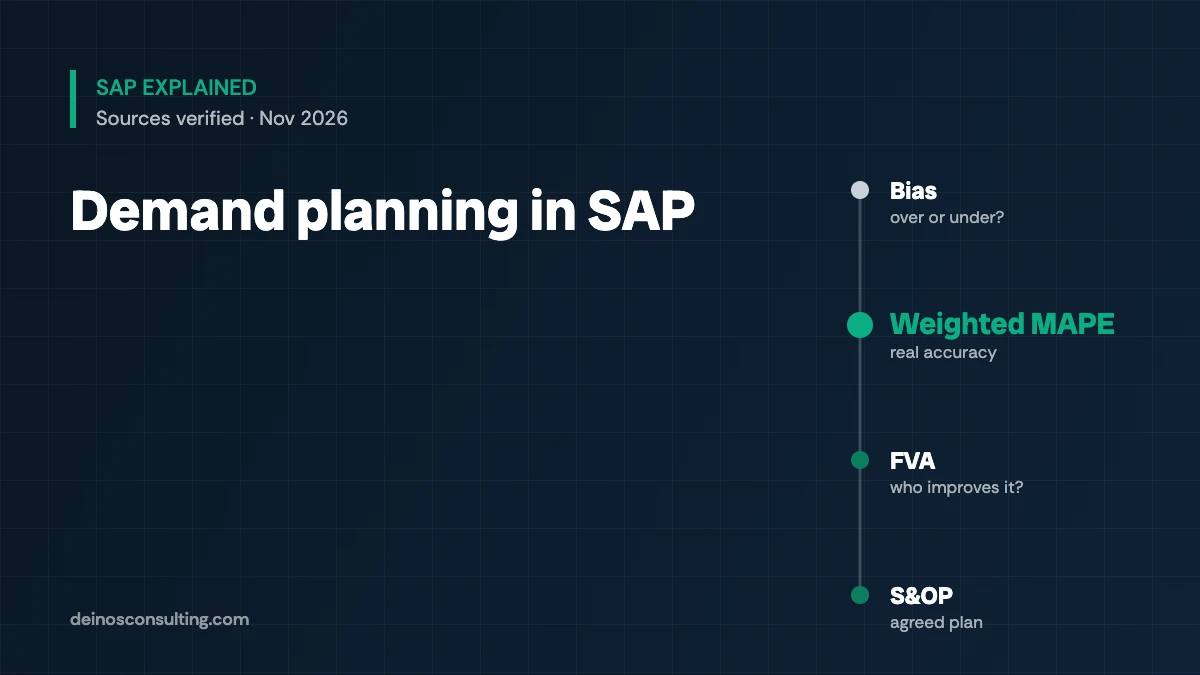
- Always measure two things: bias (do you always over- or under-forecast?) and accuracy (how far off are you?).
- Forecast value added (FVA) tells you whether each manual adjustment improves or worsens the number.
Why it matters
An inflated forecast fills your warehouses with stock that doesn’t move; a low one causes shortages, rush orders and expensive freight. Demand planning is the first link: everything downstream (MRP, purchasing, production) inherits its error.
Which tool to use
| Tool | What it does | When it fits |
|---|---|---|
| S/4HANA: planned independent requirements (PIR) | → Loads the demand plan that feeds MRP | Operations with fairly stable forecasts or forecasts calculated outside SAP. |
| S/4HANA: pMRP | → Simulates mid-term demand and capacity before releasing to MRP | Checking whether your plan is feasible; successor to ECC long-term planning. |
| IBP for Demand | → Statistical and machine-learning forecasting, history cleansing and demand sensing | Many SKUs, promotions, seasonality and a need for a collaborative process. |
| APO DP | → Classic demand planning alongside ECC | Only as a bridge: mainstream maintenance ends in 2027. |
How to tell if your forecast works
Always positive means you inflate; negative means you fall short. A good MAPE can hide bad bias.
Average absolute error as a percentage. Distorted by low-volume products.
Gives more weight to what you sell most; fairer for comparing planners.
Compares each step (statistical, sales, marketing) with the previous one to see who improves the number.
In IBP, demand sensing with gradient boosting corrects the short-term forecast with daily signals; SAP notes it doesn’t perform well on intermittent demand, so it isn’t for every product.
What it means for your Supply Chain operation
- Measure before improving. Calculate bias and weighted MAPE for the last 6 to 12 months by family.
- Segment your products. Stable ones get statistical forecasts; erratic ones need another strategy (inventory or DDMRP).
- Make FVA visible. If the sales adjustment worsens the statistical forecast, the process needs to change, not the system.
- Connect demand with S&OP. A forecast is only worth something if it ends in an agreed plan.
This article is for information only. Available features depend on your SAP version and licenses.